Component Guide: Plug-ins
In Nova plug-ins are used to extend the basic component platform with special functionality.
In order for plug-ins to function properly we must distinguish 3 different types:
- display: Some plugins, such as Raster and AgentViewerX, are used for visualization; they will want a
post-update strobe to receive the latest data.
- stateful: A second group have state values that are used to compute the values of Stocks. They need
to be updated before any processing of Stocks during the cycle. An example of the latter is the Perceptron plug-in, which models a multiple layer neural network.
- converter: A third class use the current state to produce the next, like Terms and Flows. These need
to be strobed pre-update.
Plug-in type is determined by the plug-in designer and cannot be changed.
Adding a plug-in to your model: Plug-ins appear on the Plug-in Pallet, which has the same form as the Component Pallet. To add a plug-in follow the procedure for adding components to your model.
A plug-in instance in a model work like Graph and Table displays. The Model Canvas contains the plug-in's stub, which includes input and output pins for connecting the plug-in to the rest of the model. On the dashboard the plug-in's face displays any visualization and/or control elements required for it to function. Plug-ins that have no such elements (e.g., Averager) still appear on the Dashboard as small tiles.
Communicating with Plug-ins: Right-clicking on the plug-in stub opens a Connector Dialog, like the ones used by Containers. See Connecting Container Pins for details.
Plug-in menus: Right-clicking on the plug-in's dashboard component generally opens a menu that contains selections for configuring the plug–in (in some cases no configuration is required, and so no such menu appears). The most common menu entry, Properties, opens a dialog in which a set of properties can be selected.
In some cases property or control settings may affect the configuration of input and output pins on the stub.
Standard Plug-ins
The following plug-ins are included with the Nova distribution. Images show both the plug-in face on the Dashboard and the stub on the Model Canvas.
AgentViewerX
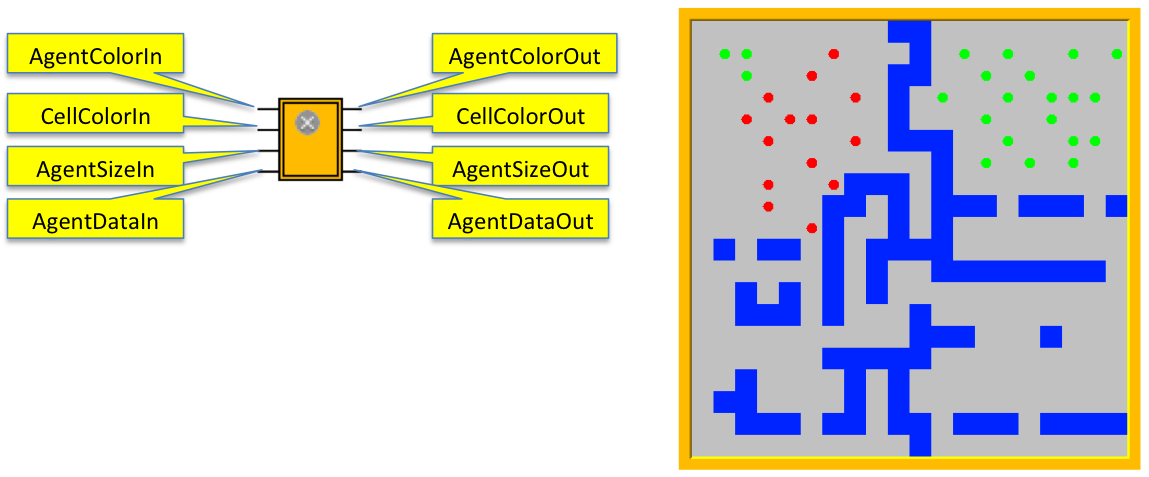 Description: The AgentViewerX (AVX) plug-in is the standard component for viewing the dynamic behavior of an AgentVector or SimWorld. (While it can be used for CellMatrices, the Raster plug-in is preferred). The AVX displays 2 layers; the first, called the matrix layer, is equivalent to the Raster plug-in, showing a cartesian array or hexagonal array (depending on the mode of the input Container) of tiles with each tile corresponding to a cell of the SimWorld's internal CellMatrix, using its row-column mapping. Tile colors correspond to some state parameter of the represented cell's submodel.
The second, agent layer, displays the agents of the SimWorld's internal AgentVector as individual tokens, mapping each agent's current location to the equivalent location in the tile array. The origin of the mapping is in the upper left corner, with positive values extending rightward and downward. Each tile represents a unit distance in horizontal and vertical distance. Values outside the represented space are disregarded unless the SimWorld is operating as a torus, in which case they wrap accordingly. Each agent can display a state value as a color or be randomly colored. An agent can also display a state value through the size of the token.
The user may specify up to 8 colors and corresponding values for coloring cells and agent tokens. Linear interpolation on the color's RGB components is used to determine colors for a value between 2 selectioned colors.
When operating in Interactive Mode the tile and token colors can be set using mouse gestures. These selections can be used to initialize the states of the corresponding cells and agents in advance of a simulation run. Selections are recorded and redisplayed each time the simulation is reset.
Plug-in Menu
Properties:
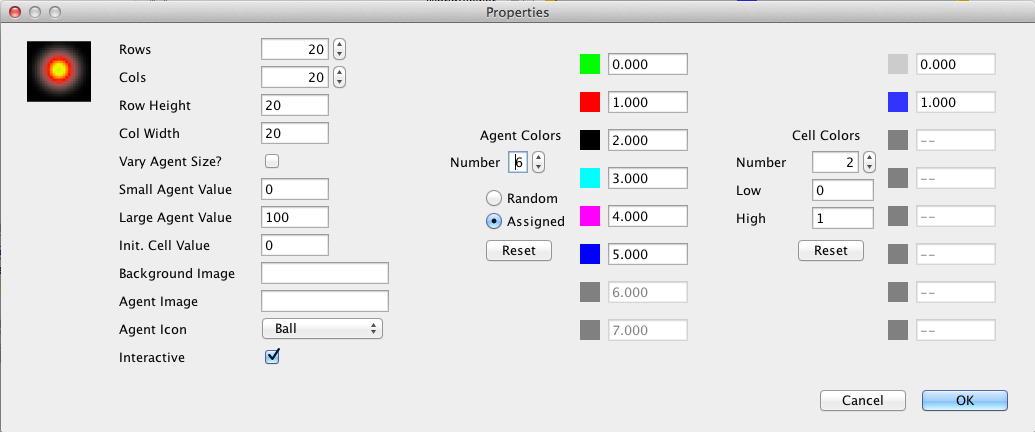
I. General
- Rows, Cols: number of rows and columns in the matrix layer. On reset this will automatically be set to the number of rows of the CellMatrix/AgentVector/SimWorld.
- Row Height, Column Width: number of pixels used to represent the height and width of the cell. Determines the plug-in's size on the dashboard.
- Vary Agent Size: if checked, the agent token will vary in size based on the input to the AgentSizeIn pin.
- Small/Large Agent Value: used to provide a scale for determining how values are mapped to actual agent token size.
- Initial Cell Value: determines the corresponding default tile color.
- Background Image: if a file containing an image is entered, this image is used as a background image and tile coloring is disabled. Only useful when displaying an AgentVector.
- Agent Image: if a file containing an image is entered, this image is used as the token. When used, token coloring is disabled.
- Agent Icon: A list of supported token types. Supports both agent color and size representation.
- Interactive: Enables Interactive Mode.
II. Agent
- Agent Colors Random/Assigned: Random coloring can be used with varying size, if so desired. If Random is selected, the rest of this section becomes disabled.
- Number: set to the number of agent token colors to be used.
- Color List: Up to 8 colors can be assigned (all slots beyond the current value of Number are disabled.) Each slot can be assigned a color and a value. (Click on the color to display the Color Chooser dialog.)
- Reset: Click to reset colors to a standard sequence (Green, Red, Black, Cyan, Magenta, Blue, Yellow, White).
III. Cell
- Number: set to the number of cell tile colors to be used.
- Low/High: Set the range of values to be represented by these colors. Values will interpolate linearly across the set of selected colors.
- Color List: Each slot can be assigned a color analogously to the Agents section.Value points are linearly deterimimed using Low and High.
- Reset: Click to reset colors to a standard sequence (Green, Red, Black, Cyan, Magenta, Blue, Yellow, White).
Plug-in menu
Reset: In Interactive Mode, removes all agent and cell selections made through mouse gestures.
Pins
Input:
- AgentColorIn: Connects to the AgentVector/SimWorld pin of the agent output to be displayed as token color.
- CellColorIn: Connects to the CellMatrix/SimWorld pin of the cell output to be displayed as tile color.
- AgentSizeIn: Connects to the AgentVector/SimWorld pin of the agent output to be displayed as token size.
- AgentDataIn: Connects to the AgentVector/SimWorld AData pin, conveying agent position and life cycle data.
Output:
- AgentColorOut: During Interactive Mode, connects to the AgentVector/SimWorld pin of the agent input to be displayed as token color.
- CellColorOut: During Interactive Mode, connects to the CellMatrix/SimWorld pin of the cell input to be displayed as tile color.
- AgentSizeOut: During Interactive Mode, connects to the AgentVector/SimWorld pin of the agent input to be displayed as token size.
- AgentDataOut: During Interactive Mode, connects to the AgentVector/SimWorld Init_Count pin, conveying initial agent position data.
Interactive Mode
- To change a tile's color left-click on that tile; successive left-clicks will cause the colors to rotate through the Cell Colors pallet defined in Properties. Alternatively, pressing the mouse on a tile and dragging across the matrix will cause the colors of dragged-over tiles to change to the color of the original tile.
- Note: Interactive Mode requires assigned agent colors. To create an agent token on a cell shift-left-click on that cell. The token will appear in the first color of the Agent Colors pallet defined in Properties. Successive shift-right-clicks will rotate the color through the pallet. A shift-right-click on the last color will delete the agent.
Averager
Description: When connected to an output pin of an aggregator, the Averager plug-in computes and outputs the running average of the pin's value over the elements of the aggregator.
Properties: No user-settable properties.
Pins
Input: The single input pin In must be connected to an aggregator pin.
Output: The output pin Out is the running average of the input over the elements of the aggregator.
Bar Graph Maker
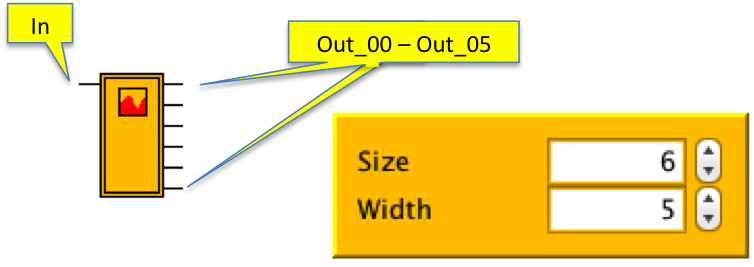
Description: The Bar Graph Maker inputs a single model value x over a time sequence and converts it to n outputs, each representing the average of that sequence during m timesteps. Those outputs are expected to be connected to a Graph component and displayed as a bar graph. For example, if n = 6 and m = 5, then x's value over the first 30 time intervals will be condensed into 6 output values. The first 5 x values will be averaged to produce the first output value; then the next 5 x values will be averaged to produce the second output value, etc.
Controls: Size and Width spinners on the plug-in determine, respectively, n (the number of outputs) and m (the number of time intervals averaged for each output).
Properties: No user-settable properties.
Pins
Input: Single input pin In connected to some value-producing component.
Output: The number of output pins Out_00 - Out_XX equals the value of Size.
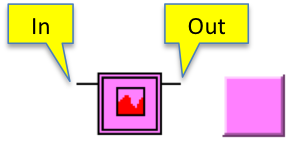
Raster
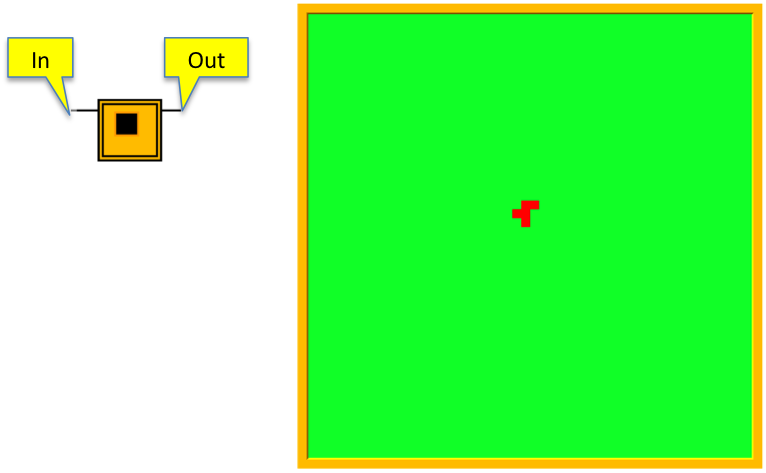
Description: The Raster plug-in
is the standard component for viewing the dynamic behavior of a CellMatrix. It displays a cartesian or hexagonal array (depending on the mode of the CellMatrix) of tiles with each tile corresponding to a cell of the CellMatrix, using its row-column mapping. Tile colors correspond to some state parameter of the represented cell's submodel.
The user may specify up to 8 colors and corresponding values for coloring cells Linear interpolation on the color's RGB components is used to determine colors for a value between 2 selectioned colors.
When operating in Interactive Mode the tile colors can be set using mouse gestures. These selections can be used to initialize the states of the corresponding cells in advance of a simulation run. Selections are recorded and redisplayed each time the simulation is reset.
Plug-in Menu
Properties: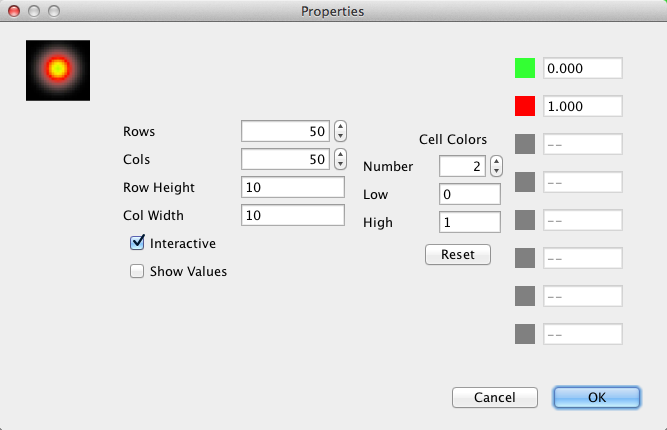
- Rows, Cols: number of rows and columns in the matrix layer. On reset this will automatically be set to the number of rows of the CellMatrix.
- Row Height, Column Width: number of pixels used to represent the height and width of the cell. Determines the plug-in's size on the dashboard.
- Interactive: Enables Interactive Mode.
- Show Values: Displays cell values inside cells when enabled.
- Number: set to the number of cell tile colors to be used.
- Low/High: Set the range of values to be represented by these colors. Values will interpolate linearly across the set of selected colors.
- Color List: Each slot can be assigned a color analogously to the Agents section.Value points are linearly deterimimed using Low and High.
- Reset: Click to reset colors to a standard sequence (Green, Red, Black, Cyan, Magenta, Blue, Yellow, White).
Plug-in menu
Reset: In Interactive Mode, removes all agent and cell selections made through mouse gestures.
Pins
Input: In connects to the CellMatrix pin of the cell output to be displayed as tile color.
Output: During Interactive Mode, Out connects to the CellMatrix/SimWorld pin of the cell input to be displayed as tile color.
Interactive Mode: To change a tile's color left-click on that tile; successive left-clicks will cause the colors to rotate through the Cell Colors pallet defined in Properties. Alternatively, pressing the mouse on a tile and dragging across the matrix will cause the colors of dragged-over tiles to change to the color of the original tile.